
It is often seen that people are confused between Return on Equity (ROE) and Return on Capital Employed (ROCE). Both are important metrics to evaluate companies listed on the Indian stock market, but they tell us different stories about a company’s performance. Let Capitalment break this down in the simplest way possible.
What is ROE (Return on Equity)?
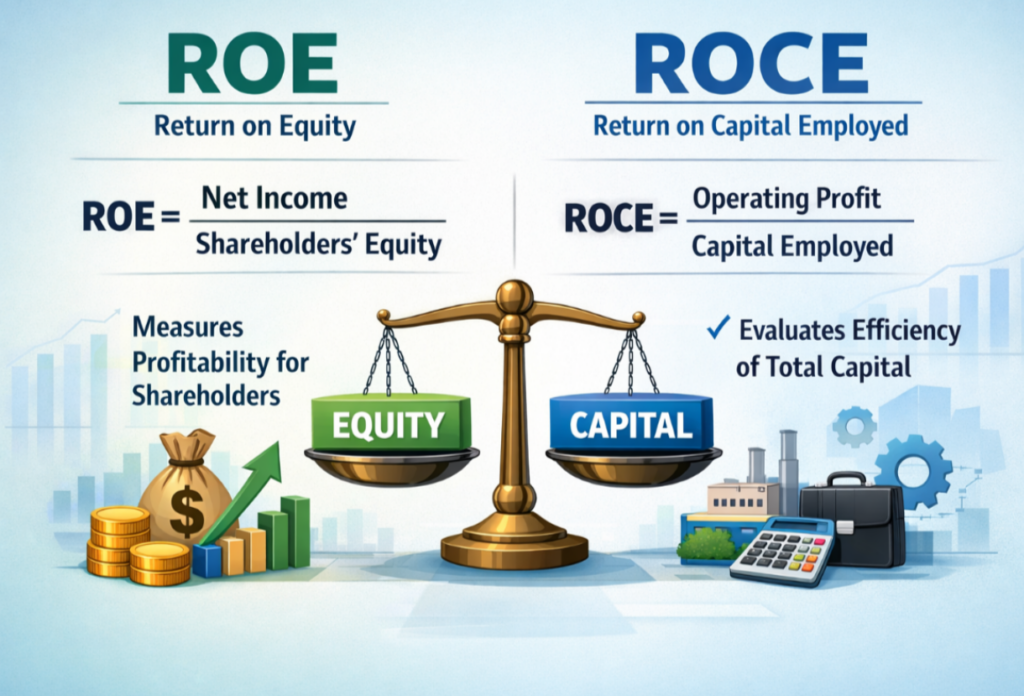
Return on Equity measures how much profit a company generates for every rupee that shareholders have invested.
Example : if you and your friends pool together ₹10,000 to start a small tea stall, and at the end of the year you make ₹2,000 in profit, your ROE would be 20%.
Formula: ROE = Net Profit ÷ Shareholder’s Equity × 100
For example, if Reliance Industries has a net profit of ₹60,000 crores and shareholder’s equity of ₹5,00,000 crores, the ROE would be 12%. This means for every ₹100 that shareholders have invested, the company generates ₹12 in profit.
What is ROCE (Return on Capital Employed)?
Return on Capital Employed looks at how efficiently a company uses all the money available to it, not just shareholder money but also borrowed money.
It tells us how well the company is using both equity and debt to generate profits.
Formula: ROCE = Earnings Before Interest and Tax (EBIT) ÷ Capital Employed × 100
Capital Employed = Total Assets – Current Liabilities (or Shareholder’s Equity + Long-term Debt)
Let’s say Tata Motors has EBIT of ₹15,000 crores and capital employed of ₹1,00,000 crores. The ROCE would be 15%. This means the company generates ₹15 for every ₹100 of capital it uses, whether that capital comes from shareholders or lenders.
The Key Difference:
A Simple Example
Imagine two friends, Vishal and Arti, both running small businesses:
Vishal’s Business:
His own money (equity): ₹50,000
Borrowed money (loan): ₹50,000
Total capital: ₹1,00,000
Profit after interest: ₹10,000
Profit before interest: ₹15,000
Arti’s Business:
Her own money (equity): ₹1,00,000
Borrowed money: ₹0
Total capital: ₹1,00,000
Profit: ₹12,000
Now let’s calculate:
Vishal’s Ratios:
ROE = 10,000 ÷ 50,000 = 20%
ROCE = 15,000 ÷ 1,00,000 = 15%
Arti’s Ratios:
ROE = 12,000 ÷ 1,00,000 = 12%
ROCE = 12,000 ÷ 1,00,000 = 12%
Notice how Vishal’s ROE looks better (20%) even though he’s using borrowed money. ROCE gives us a more complete picture by showing how efficiently he’s using all the capital, regardless of where it comes from.
Why Both Matter in the Indian Stock Market
When analyzing Indian companies like Infosys, HDFC Bank, or Asian Paints, both metrics help you understand different aspects:
ROE tells you: How much the company is earning for shareholders specifically. A company can have high ROE but might be heavily dependent on debt, which could be risky.
ROCE tells you: How efficiently the company uses all resources available to it. This is especially useful for comparing companies in capital-intensive sectors like manufacturing, infrastructure, or automobiles.
Real-World Indian Stock Market Example
Let’s consider two hypothetical scenarios based on typical Indian companies:
Company A (IT Sector – like Infosys):
Typically has low debt
ROE: 25%
ROCE: 24%
Both ratios are similar because the company uses very little debt
Company B (Infrastructure Sector – like L&T):
Uses significant debt for projects
ROE: 18%
ROCE: 12%
ROE is higher because the company leverages debt, but ROCE shows the overall capital efficiency is lower
Key Takeaways
Important Differences:
ROE focuses only on shareholder’s money, while ROCE considers all capital including borrowed funds
ROE uses net profit after paying interest on loans, while ROCE uses profit before interest payments
A big gap between ROE and ROCE indicates heavy use of debt financing
For debt-free companies, ROE and ROCE will be very similar or almost equal
ROCE is better for comparing companies across different debt structures
When to Use Which:
Use ROE when you want to know returns specifically for equity shareholders
Use ROCE when comparing companies with different debt levels or analyzing capital-intensive businesses
Look at both together to get a complete picture of the company’s financial health
In the Indian context, always compare these ratios with industry averages
Red Flags to Watch:
Very high ROE but low ROCE suggests excessive debt dependence
Declining ROCE over time indicates deteriorating operational efficiency
ROE and ROCE both below 10% in most sectors suggests poor management of resources
Compare with competitors and industry standards in BSE or NSE listings
Capitalment Practical Advice for People’s
When you’re analyzing stocks on NSE or BSE, don’t just look at one ratio. A company might show impressive ROE because it has borrowed heavily, but if ROCE is low, it means the company isn’t using all that capital efficiently. This could lead to trouble if interest rates rise or business slows down.
Always remember: high returns are good, but sustainable returns are better. Both ROE and ROCE help you judge if a company is truly performing well or just using financial engineering to make numbers look good.
CAPITALMENT POINTS
Think of ROE as your personal savings account return, and ROCE as the return on all money you’ve managed including what you’ve borrowed from friends. Both matter, but they tell different stories about your financial success.